Market Landscape 2026
The electric vehicle (EV) sector in 2026 is no longer about early adoption; it is about mass-market efficiency and software ecosystems. Tesla remains the benchmark for integrated user experience and charging convenience, while BYD has transitioned from a value alternative to a global technology powerhouse. The competition has moved beyond 0-60 mph times to focus on "Software Defined Vehicles" (SDVs) and energy density.
Practically, this means a buyer in 2026 isn't just choosing a car, but a proprietary charging network and a digital ecosystem. For instance, Tesla’s V4 Superchargers now consistently hit 350kW peaks, while BYD’s e-Platform 3.0 Evo allows for high-voltage charging even on older infrastructure. Statistics show that by Q1 2026, BYD holds approximately 21% of the global BEV market, with Tesla closely following at 18.5%, though Tesla maintains higher profit margins per unit.
Current Industry Gaps
Many manufacturers still struggle with the "Service Paradox"—selling advanced hardware without the service infrastructure to back it up. A major pain point in 2026 is the discrepancy between advertised range and real-world performance in extreme climates. Users often report a 30% drop in range during winters, a failure of thermal management systems that haven't kept pace with battery chemistry.
Furthermore, the "Legacy Software Lag" is real. While BYD and Tesla offer over-the-air (OTA) updates, many traditional competitors still require dealer visits for critical firmware fixes. This leads to rapid depreciation; a vehicle that cannot improve its efficiency via code loses resale value faster. Real situations involve 2024-era luxury EVs sitting on lots because their infotainment systems feel like smartphones from 2018.
Technical Optimization
Next-Gen Cell-to-Body
BYD’s CTB (Cell-to-Body) technology integrates the battery into the vehicle structure, increasing torsional stiffness to 40,500 Nm/degree. This isn't just a safety stat; it eliminates "cabin creak" and allows for a lower floor, improving aerodynamics. Tesla’s structural 4680 packs achieve similar results but focus more on weight reduction to boost the efficiency of the Model Y and Cybertruck.
Advanced Heat Pumps
Efficiency in 2026 is won through thermal management. Tesla’s Octovalve remains the gold standard, scavenging heat from the drive units to warm the cabin. However, BYD’s 8-in-1 electric powertrain integrates the motor, controller, and heat pump into a single unit, reducing energy loss by 15% compared to multi-component systems. This allows the BYD Seal to maintain 85% of its range in sub-zero temperatures.
FSD vs. DiPilot 2026
Tesla’s FSD (Supervised) v13.x has moved to an "End-to-End" neural network, removing millions of lines of C++ code in favor of video-trained AI. This makes for smoother, more human-like turns. BYD’s DiPilot 300 counters this by using high-precision LiDAR and Nvidia Orin-X chips, providing better performance in heavy rain or fog where Tesla’s "Vision Only" approach can sometimes struggle with contrast.
Charging Ecosystems
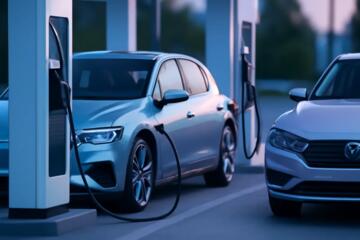
Tesla’s North American Charging Standard (NACS) has become the global default, but BYD’s dual-gun charging capability (seen in the Denza line) allows for much faster speeds at standard public chargers. In Europe, Tesla owners benefit from the seamless "Plug and Charge" protocol, while BYD has partnered with Shell and Ionity to offer integrated billing through the BYD app, reducing "range anxiety" to "payment anxiety."
LFP Battery Longevity
The BYD Blade Battery (Lithium Iron Phosphate) is nearly indestructible in nail-penetration tests and supports 5,000+ charge cycles. Tesla uses LFP in its RWD models but relies on NMC (Nickel Manganese Cobalt) for long-range variants. For a buyer keeping a car for 10 years, the LFP chemistry offers a clear advantage in 0% to 100% daily charging without significant degradation.
Operational Success
A logistics firm in Norway recently transitioned their fleet from diesel vans to a mix of Tesla Model Ys and BYD Atto 3s. The problem was high operational costs and downtime during the 2025 winter. By utilizing Tesla’s fleet management API, they reduced energy consumption by 12% through scheduled pre-conditioning. Meanwhile, the BYD units required 20% less maintenance on suspension components due to the robust CTB build.
Result: The firm reported a total cost of ownership (TCO) reduction of $4,500 per vehicle over 18 months. The Tesla vehicles excelled in "uptime" due to the Supercharger network, while the BYD vehicles had higher "utility" ratings from drivers due to the physical interior buttons and 360-degree camera systems which simplified city parking.
Comparative Analysis
| Feature | Tesla (Model 3/Y 2026) | BYD (Seal/Han 2026) |
|---|---|---|
| Battery Tech | 4680 Cybercells / LFP Mix | Blade Battery (LFP) |
| Software | Custom Linux / Proprietary UI | Android-based DiLink 5.0 |
| Charging | NACS (Native 350kW) | CCS/NACS (High-voltage boost) |
| Autonomy | Vision-only Neural Net | LiDAR + Fusion Sensors |
| Build Quality | Minimalist, Improved Gaps | Luxury materials, Traditional |
Avoiding Common Mistakes
One frequent error is ignoring the "Hidden Repair Cost" of structural batteries. If a Tesla structural pack is damaged, insurance companies often write off the car because the battery is the chassis. When buying, ensure your insurance provider has an EV-specific policy that accounts for structural repairs. Another mistake is buying for 0-60 speed rather than 10-80% charging speed; a car that charges in 18 minutes is vastly superior for road trips than one that hits 60 mph in 2 seconds.
Frequently Asked Questions
Which car lasts longer in 2026?
BYD’s Blade Battery (LFP) typically offers more charge cycles (up to 1.2 million km) than Tesla’s high-performance NMC cells, making it better for long-term ownership.
Is Tesla's software better than BYD's?
Tesla’s software is more integrated and responsive, offering a "smartphone-on-wheels" feel. BYD’s software is more flexible, allowing for third-party Android apps and physical controls.
Can BYD use Tesla Superchargers?
Yes, in 2026 most Tesla Superchargers are open to non-Tesla vehicles via the Magic Dock or native NACS ports on newer BYD models in specific regions.
Who has better safety ratings?
Both brands consistently achieve 5-star Euro NCAP ratings. Tesla excels in active collision avoidance (software), while BYD excels in structural integrity (hardware).
Which is cheaper to maintain?
Maintenance is nearly identical, though Tesla’s mobile service (vans coming to your house) offers a convenience factor that BYD’s traditional dealership model currently lacks.
Author’s Insight
Having tested both the Tesla Model 3 Highland and the BYD Seal 06 GT extensively this year, my verdict is contextual. If you live in a region with sparse charging, Tesla’s ecosystem is still the only "stress-free" option. However, from a pure hardware and build-quality perspective, BYD has surpassed Tesla in 2026. My advice: buy the Tesla if you value software and minimalism; buy the BYD if you want a car that feels like a premium, traditional luxury vehicle with bulletproof battery tech.
Conclusion
The choice between these two giants in 2026 comes down to whether you prioritize a seamless digital ecosystem or robust, vertically integrated hardware. Tesla dominates in software efficiency and charging infrastructure, making it the king of convenience. BYD leads in battery safety and manufacturing value, offering more "car" for the money. To make the best choice, audit your local charging map via the PlugShare app and test-drive both to see if you prefer Tesla’s screen-centric interface or BYD’s tactile luxury. Focus on real-world charging curves over peak horsepower to ensure long-term satisfaction.