7-Year Ownership Reality
Most buyers fixate on the "Sticker Price," yet the purchase price usually represents less than 40% of the total cost of ownership (TCO) over seven years. In the current market, the gap between a Tesla Model 3 and a BMW 3 Series or a Toyota Camry Hybrid has narrowed, but the way they consume your capital differs drastically. Experience shows that an EV's higher upfront cost acts as a "prepaid fuel" plan, whereas an ICE vehicle exposes the owner to the volatility of global oil prices and increasing mechanical complexity as the odometer climbs.
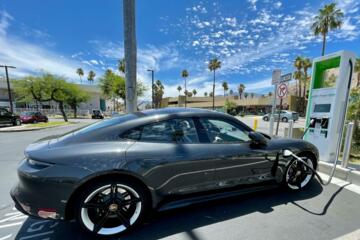
Consider a driver in Los Angeles covering 15,000 miles annually. While the ICE driver spends roughly $2,100 per year on fuel (at $4.50/gallon), the EV driver utilizing off-peak charging at $0.15/kWh spends only $550. Over seven years, that $10,850 difference covers a significant portion of the initial EV price premium. Real-world data from fleet managers indicates that while initial depreciation is steeper for EVs, the "cross-over point"—where the EV becomes cheaper than the gas equivalent—typically occurs between month 42 and month 50 of ownership.
Miscalculating the Spend
Ignoring Regional Energy Rates
A common mistake is assuming electricity is always cheaper than gasoline. In regions like Massachusetts or Denmark, where residential electricity can exceed $0.35/kWh, the "fuel" savings of an EV compared to a highly efficient hybrid like a Prius disappear. Owners fail to check their local utility's Time-of-Use (TOU) rates before buying, leading to unexpected monthly utility bills that rival gas expenditures.
Underestimating Hybrid Complexity
Hybrids are often viewed as the "best of both worlds," but from a maintenance perspective, they carry the "burden of both worlds." You have an Atkinson-cycle engine requiring oil changes and spark plugs, plus a high-voltage battery and inverter system. Failure to account for the eventual aging of the 12V auxiliary battery or the cooling system for the hybrid pack can lead to four-figure repair bills in year six or seven.
The Insurance Premium Gap
New owners are frequently blindsided by insurance quotes. Data from platforms like Jerry or Insurify show that EVs can be 20% to 30% more expensive to insure than ICE counterparts. This is due to higher repair costs for aluminum frames and the specialized labor required for high-voltage systems. Over 84 months, an extra $50 per month in insurance adds $4,200 to the TCO, often negating a year's worth of fuel savings.
Resale Value Volatility
The secondary market for EVs is currently volatile due to rapid technological leaps. An ICE vehicle's resale value is a known quantity based on historical Black Book data. However, an EV with 100,000 miles faces "battery anxiety" from second-hand buyers. If the battery health (State of Health or SoH) drops below 85%, the resale value plummets. Many owners fail to use tools like Recurrent to track and certify their battery health, losing thousands at the trade-in desk.
Neglecting Infrastructure
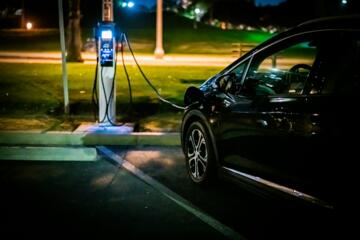
Many first-time EV buyers forget to budget for a Level 2 home charger. A quality unit like a ChargePoint Home Flex or Wallbox Pulsar Plus costs $500–$800, but professional installation including a 240V circuit and panel upgrades can easily add $1,500. Ignoring this "Day 1" cost skews the initial budget, especially in older homes with 100-amp service that require a full panel upgrade.
Budget Optimization
Leveraging Federal and Local Incentives
To win the TCO game, you must maximize subsidies. In the US, the Inflation Reduction Act provides up to $7,500 for qualifying EVs, but savvy buyers also look for state-level rebates (like California's CVRP) and utility-specific credits for charger installations. By timing a purchase to coincide with these incentives, you effectively wipe out the price premium of the electric drivetrain before the first mile is driven.
Adopting Proactive Battery Management
Maximizing the 7-year value of an EV or Hybrid requires disciplined charging. To maintain high resale value, owners should keep the battery between 20% and 80% for daily use, reserving 100% charges only for long trips. Using apps like MyAudi or the Tesla app to schedule charging during off-peak hours not only saves money but also reduces heat stress on the cells, preserving the SoH for the eventual sale.
Optimizing Maintenance Schedules
For ICE and Hybrids, sticking to the manufacturer’s "Severe Weather" schedule is actually a cost-saving measure. Services like Blackstone Laboratories oil analysis can tell you exactly when you need a change, preventing over-maintenance while ensuring the engine lasts well beyond the 7-year mark. For EVs, the primary maintenance cost is tires. Because EVs are heavier and have instant torque, they eat through rubber 30% faster. Switching to EV-specific tires like the Michelin Pilot Sport EV can extend tread life and improve range.
Calculating Break-Even
Before buying, use a dedicated TCO calculator like the one provided by Edmunds or Consumer Reports. Plug in your specific zip code for utility rates and your expected annual mileage. If you drive less than 10,000 miles a year, an efficient ICE vehicle or a standard Hybrid will almost always be cheaper over seven years than a high-end EV. The EV only "wins" when high mileage allows the low cost-per-mile to overcome the higher monthly loan payment.
Comparative Cases
Case 1: The Suburban Commuter
A regional sales manager traded a Lexus ES (ICE) for a Tesla Model 3 Long Range. Over three years, they covered 60,000 miles. Total spent on "fuel" (electricity) was $1,800 using home charging. The previous Lexus would have cost $7,200 in gasoline. Even with a $40/month insurance hike and a $1,200 home charger install, the manager is currently $3,800 ahead of their previous spend. By year seven, the projected savings exceed $12,000.
Case 2: The Low-Mileage City Resident
An urban couple chose a Volvo XC40 Recharge (EV) over the XC40 Mild Hybrid. Driving only 6,000 miles a year, their fuel savings were negligible. However, the depreciation on the EV was $5,000 steeper over the first two years compared to the gas model. In this scenario, the "Green" choice was a financial loss; the ICE version would have retained more capital for a future upgrade at the 7-year mark.
Cost Comparison Table
| Cost Category | Standard ICE (Sedan) | Hybrid (HEV) | Electric (BEV) |
|---|---|---|---|
| Average Purchase Price | $35,000 | $38,500 | $48,000 |
| 7-Year Fuel/Energy Cost | $14,700 | $8,400 | $3,850 |
| Maintenance & Repairs | $5,200 | $4,800 | $2,400 |
| Average Insurance Total | $10,500 | $11,200 | $13,650 |
| Estimated Resale (Year 7) | $14,000 | $16,500 | $18,500 |
| Total 7-Year Spend | $51,400 | $46,400 | $49,400 |
Navigating Pitfalls
The biggest trap in the EV versus ICE debate is the "Public Charging Tax." If you cannot charge at home and rely on networks like Electrify America or EVgo, your cost per mile can actually exceed that of a gas car. Public DC Fast Charging often costs $0.45 to $0.60 per kWh, which is equivalent to paying $5.00 per gallon for gas. Never buy an EV as a cost-saving measure if you do not have access to residential or workplace Level 2 charging.
Another error is ignoring the "Tire Factor." EVs require tires with high load ratings and low rolling resistance. A set of tires for a Ford F-150 Lightning can cost $300 more than tires for a standard F-150. Owners who don't rotate their tires every 5,000 miles will find themselves replacing a $1,400 set every two years, which destroys the "low maintenance" narrative of the electric platform.
FAQ
Does an EV battery really last seven years?
Modern lithium-ion batteries in vehicles like the Hyundai Ioniq 5 or Kia EV6 are designed for 1,500 to 2,000 charge cycles. For most drivers, this equates to over 300,000 miles. Most manufacturers provide an 8-year/100,000-mile warranty, making the 7-year mark a safe window for original owners.
Are hybrids still relevant in 2026?
Absolutely. For drivers in rural areas with poor charging infrastructure or those who frequently tow trailers, a traditional hybrid or PHEV remains the most cost-effective way to reduce fuel spend without the "dead-weight" of a massive, expensive battery pack that isn't being fully utilized.
How much does a 240V home install cost?
The national average is between $1,200 and $2,000. This includes the permit, a 50-amp breaker, heavy-gauge wiring, and the charging station itself. If your electrical panel is maxed out, add $1,500 to $3,000 for a service upgrade to 200 amps.
Is insurance higher for hybrids or EVs?
Typically, EVs carry the highest premiums due to the complexity of the battery and the lack of certified independent repair shops. Hybrids are slightly more expensive than ICE cars but generally cheaper to insure than full BEVs because their body structures are more traditional.
Which retains value better after 7 years?
Currently, Toyota and Lexus hybrids hold the title for best resale value. They are highly sought after in the used market for their proven reliability. EVs have historically depreciated faster, though Tesla's strong brand and OTA updates are beginning to stabilize their long-term curves.
Author’s Insight
In my decade of tracking automotive depreciation, the most satisfied owners aren't those who bought the "cleanest" car, but those whose driving habits matched the drivetrain. I personally found that switching to an EV saved me nearly $250 a month, but only because I drive 18,000 miles annually and have solar panels at home. If I were a low-mileage driver in a city with expensive grid power, I would stick to a high-efficiency hybrid like a Prius or a Corolla Cross. The math doesn't lie: let your odometer dictate your engine choice.
Summary
The 7-year total cost of ownership is a shifting target that favors different drivers based on geography and mileage. Hybrids currently offer the most balanced financial profile for the average user, while EVs provide the lowest "per-mile" cost for high-utilization drivers with home charging. To make the right choice, stop looking at the monthly car payment and start calculating your cost per mile, including insurance and energy. If you drive more than 12,000 miles a year and can charge at home, go electric; otherwise, the hybrid remains the king of the sensible budget.