Measuring Real-World Fuel Use
Fuel economy tests in official settings often differ from what drivers encounter daily. Reviewers strive to capture numbers that reflect actual usage, avoiding laboratory-only figures. For instance, the EPA rates vehicles under standardized cycles, but real drivers might experience 10-20% worse mileage due to traffic, weather, and driving style. A 2022 study by the Consumer Reports indicated average on-road fuel consumption consistently fell short of advertised ratings by around 8%. Methods involve driving on mixed routes covering highways, city streets, and stop-and-go traffic to approximate daily conditions.
Reviewers may record fuel consumed over 100+ miles using onboard diagnostics or manual refilling and calculation. Variations in temperature—from 30°F winter mornings to 90°F summer afternoons—shift results noticeably. Highways generally stretch mileage figures, but steep hills or aggressive acceleration pull them down.
Common Missteps in Fuel Testing
Many mistakenly assume sticker MPG or combined EPA numbers match everyday driving, but that leads to frustration and distrust. Test setups that do not reflect real traffic conditions, such as constant speed runs without stops, produce overly optimistic data. Ignoring factors like tire inflation, vehicle load, or fuel quality also skews estimates.
Consider delivery drivers navigating frequent stops with heavy cargo—they consume far more fuel than highway test cycles would suggest. Failing to include different driving environments produces numbers that are useless for consumers. Several automakers have faced lawsuits because consumers discovered actual mileage was notably poorer than marketing suggested.
Practical Ways to Check Fuel Economy
Use Accurate Fuel Logs
Tracking every fill-up and miles driven helps assess fuel use. An app like Fuelio or MileIQ can log data automatically, removing user errors in math. This method works well for anyone willing to maintain consistent records over weeks or months. Results typically vary by 3-5% if done correctly.
Data from Onboard Diagnostics
OBD-II tools, such as the ScanGauge II, connect to a vehicle's computer and provide real-time fuel flow rates and cumulative consumption data. Reviewers often use these devices to gather detailed snapshots during various drive conditions. This approach reveals instant fuel economy fluctuations, not just averages, offering deeper insights.
Perform Mixed Route Testing
Driving a vehicle through city blocks, suburban roads, and highways multiple times simulates daily use. Reviewers measure fuel before and after the trip to calculate miles per gallon accurately. The combined average is closer to what most drivers experience compared to purely highway tests.
Control External Influences
To reduce variability, testers select days with moderate temperature and calm wind. They maintain tire pressures to manufacturer levels and avoid carrying excessive loads. Consistent driving style—steady acceleration and braking—helps isolate the vehicle's efficiency rather than driver habits.
Compare Against Baselines
Review teams sometimes run tests on a benchmark vehicle model to validate conditions and equipment accuracy. If a known car returns expected fuel figures, subsequent tests gain credibility. This practice identifies procedural flaws before data gets published.
Use GPS and Speed Monitoring
Real-time plotting of speed, elevation, and route conditions helps link mileage drops to challenging road segments. GPS data combined with OBD fuel flow readings reveals how hills or stop lights affect fuel use in specific locales. Reviewers note these patterns in detailed reports.
Account for Fuel Quality
Gasoline octane rating and additives vary by region and filling station. Reviewers often test fuel samples or select known suppliers to minimize influence of inconsistent fuel. In some cases, lower octane or off-brand gas reduces mileage by 1-2 MPG compared to premium or branded grades.
Analyze Weather and Temperature
Outside temperature affects engine warm-up, air density, and tire friction. Testing in winter months often shows 10-12% worse economy versus summer runs. Reviewers log temperature carefully, sometimes using specialized sensors, to explain dips in fuel efficiency.
Review Driver Influence
Experienced testers keep driving style uniform across tests to minimize human impact. Comparing results from aggressive versus steady acceleration clearly demonstrates how habits affect fuel use. This insight helps consumers understand how their behavior can shift outcomes.
Examples from Tests
One automotive review team tested a 2023 Toyota Corolla Hybrid on 50 miles of mixed roads in Arizona. The EPA combined rating was 52 MPG. Their measured average over several repeated drives hovered at 47.5 MPG, a 9% drop, attributed mostly to hilly terrain and stoplights. They used an OBD-II logger (ScanGauge II, version 2.4) and confirmed tire pressures before each run.
A delivery company operating a 2022 Ford Transit van wanted better insight into fuel costs. They logged fuel usage over 1,200 miles with manual fill-ups and used the data to analyze route efficiency. Their reported consumption was 14.2 MPG, about 15% worse than EPA highway rating. Adjusting driver routes and optimizing loads improved mileage by 7% over three months after retesting.
Checklist for Accurate Checks
| Step | Action | Why | Tools |
|---|---|---|---|
| 1 | Fill tank completely | Accurate start point | Fuel nozzle, pressure gauge |
| 2 | Drive set route | Consistent conditions | GPS, map app |
| 3 | Record miles driven | Calculate MPG | Odometer, smartphone |
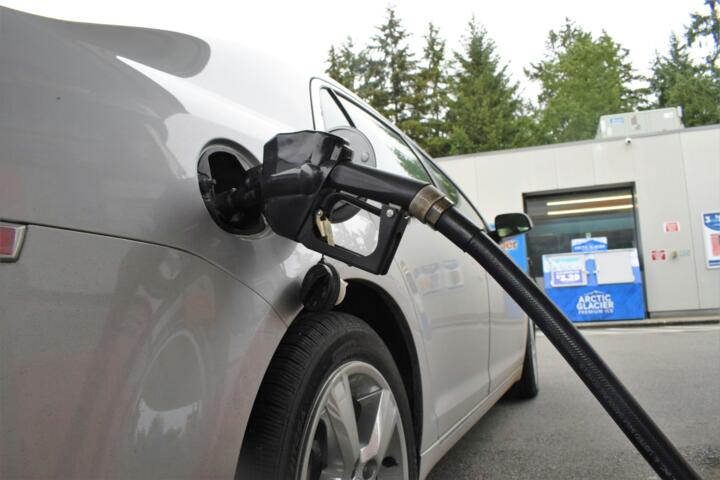
| 4 | Refill tank fully | Measure fuel used | Fuel pump with volume |
| 5 | Divide miles by fuel | Get MPG figure | Calculator, spreadsheet |
Mistakes & Fixes
Starting tests without a full tank leads to errors in consumption calculation. Always fill to a standard level before testing.
Driving wildly during tests results in inconsistent data. Driver discipline is not optional, and yet many overlook it.
Skipping temperature or tire pressure checks causes invisible bias. Measure and adjust these before every run.
Relying solely on computer readouts without manual cross-checks may introduce errors from sensor glitches. Confirm numbers with manual fuel receipts.
Running a test on a single day ignores daily variability. Repeat tests over more days or times.
FAQ
How close are EPA ratings to real driving?
EPA combined ratings tend to be optimistic. On average, real-world driving often yields 5-15% lower mileage, depending on conditions.
Can I trust onboard computer MPG readings?
OBD and in-dash computers provide useful estimates but can vary by 2-4% from actual fuel consumed. Cross-check with fill-ups.
Does weather affect fuel economy?
Yes, cold temperature, wind, and rain lower fuel efficiency by increasing engine load and aerodynamic drag.
What driving style conserves fuel best?
Gentle acceleration, steady speeds, and anticipating traffic leads to better mileage than rapid accelerating or braking.
How often should fuel economy tests be done?
For accuracy, tests repeated under varied conditions over weeks provide reliable averages, not a single drive.
Author's Insight
Through years of testing, I learned that consistency beats perfection. Even with the most precise tools, slight variations occur. Yet, by controlling distractions and logging every metric, I got remarkably reliable figures. The biggest surprise was how often drivers blame the car, when their habits doubled consumption. Using simple apps and OBD devices taught me to trust numbers less and context more.
Summary
Real-world fuel economy depends on controlled testing and honest data recording. Tracking fuel consumption over multiple drives with consistent conditions reveals how cars perform daily. Avoid common pitfalls like incomplete tanks, erratic driving, and ignoring environmental factors. With the right tools and care, mileage numbers can reflect true vehicle efficiency and help make better purchase or fleet decisions.