Curve Basics
Why curves matter
An EV charging curve is the line that shows how much power the car accepts at each state of charge. Most electric vehicles charge fastest when the battery is low, then taper as the pack fills. That is why the industry usually compares DC fast charging from 10% to 80%, not 0% to 100%.
The key metric is not only peak charging power. A Tesla Model Y may briefly show a high number, then drop hard near 50% state of charge. A Porsche Taycan, Hyundai IONIQ 6 or Kia EV6 may hold high power longer, which makes the stop shorter even if the peak looks similar on paper.
In P3’s 2024 benchmark, the updated Porsche Taycan reached 325 kW peak and averaged 282 kW between 10% and 80% state of charge. It added 383 km of real-world range in 20 minutes. Hyundai IONIQ 6 added 346 km, and Kia EV6 added 309 km in the same 20-minute window.
2024 baseline
The 2024 data showed that 800-volt EVs had become the practical road-trip benchmark. Hyundai’s E-GMP cars, Porsche’s Taycan, Audi e-tron GT and Xpeng G9 demonstrated that high voltage plus thermal control matters more than headline battery size.
For buyers, the lesson was clear: a car that adds 300 km in 20 minutes is more useful on a highway than a car with a larger battery that charges slowly. P3 also noted that the top three 2024 performers all exceeded 300 km of real range added in 20 minutes for the first time in that ranking.
2026 shift
By 2026, the market has moved from “can this EV fast charge?” to “how flat is the curve, how efficient is the car, and can the network support it?” Edmunds’ updated EV Charging Test ranks the 2024 Hyundai IONIQ 6 Limited RWD at 926 miles per charging hour, the 2026 Mercedes-Benz CLA 250+ at 833 mi/hr, and the 2025 Porsche Taycan Performance Battery Plus at 821 mi/hr.
Recurrent’s 2026 fast-charging ranking shows the same direction: the leading vehicles cluster around roughly 8–9 minutes to add 100 miles, with names such as Hyundai IONIQ 6, Porsche Taycan, Lucid Air, Lucid Gravity, Kia EV6, Genesis GV60, Porsche Macan Electric and Audi e-tron GT.
The infrastructure ceiling is also rising. Tesla lists V4 Supercharger hardware at up to 500 kW for passenger vehicles and 1.2 MW for Semi, with V4 cabinets offering up to 1,200 kW shared by eight posts. IONITY is rolling out Alpitronic HYC1000 chargers that can allocate up to 600 kW to one vehicle where the car supports it.
Pain Points
The biggest mistake is shopping by peak kW. A 350 kW charger does not make every car charge at 350 kW. The vehicle’s battery voltage, current limit, software, thermal state and state of charge decide the actual curve.
The second problem is poor arrival state of charge. Many drivers reach a fast charger at 45–60% because they feel safer. In practice, that often puts the battery into the slower part of the curve. A well-planned stop at 10–20% can cut the session by several minutes.
The third issue is charging past 80% during road trips. Above 80%, most EVs reduce charging power sharply to protect the battery. On a busy Electrify America, EVgo, Fastned or IONITY site, staying from 80% to 95% may take as long as the first half of the session.
The real-life consequence is wasted time, blocked chargers and higher cost. If a driver pays by minute, tapering is expensive. If a site charges idle fees, poor planning can become a direct penalty. If a fleet vehicle waits 18 extra minutes per stop, the cost is not just electricity; it is labor time and missed jobs.
Practical Fixes
A better test
When comparing EV charging speed curves, ask five questions: peak kW, average kW from 10–80%, time to add 100 miles, range added in 20 minutes, and real consumption in kWh/100 miles or kWh/100 km. Edmunds uses miles per charging hour because efficiency and charging speed together determine how fast useful range returns.
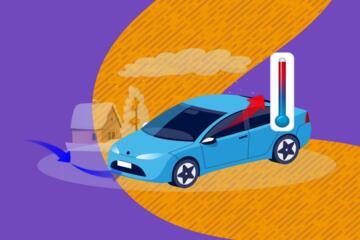
For everyday driving, use the car’s native navigation to precondition the battery before DC fast charging. Tesla, Porsche, Hyundai, Kia, BMW, Mercedes-Benz and Lucid systems can warm or cool the pack when a fast charger is set as the destination. In practice, this can be the difference between seeing 80 kW and 220 kW at the same charger in cold weather.
Choose the right charger for the car. A Chevrolet Bolt, Nissan Leaf or older 400-volt EV does not need a 350 kW stall unless nothing else is available. A Hyundai IONIQ 5, IONIQ 6, Kia EV6, Porsche Taycan, Audi e-tron GT, Lucid Air or Lucid Gravity should get the highest-power stall when the route depends on a short stop.
Use real services, not guesses. ABRP can simulate routes with weather, elevation, chargers and vehicle choice. PlugShare is useful for recent driver reports. Tesla navigation is strongest inside the Supercharger network. Electrify America, EVgo, Fastned and IONITY apps are useful for live availability, pricing and session control.
For fleets, measure charging as operations data. Track arrival state of charge, departure state of charge, average kW, minutes plugged in, minutes waiting, kWh delivered, failed starts and charger brand. After 30 days, the bad sites and inefficient driver habits become obvious.
Mini Cases
Case 1: regional sales fleet. A 14-car sales team running 400–600 km highway days had mixed EVs and random charging behavior. Drivers often arrived at 45% and charged to 95%, creating 38–45 minute stops. The company moved to ABRP route templates, set “arrive at charger near 15%” as the standard, and told drivers to leave around 70–80% unless the next leg required more. Average stop time fell from 41 minutes to 24 minutes, saving about 17 minutes per charging event.
Case 2: airport transfer operator. A shuttle company comparing large EVs looked only at battery size and missed the charging curve. After testing Kia EV9, Hyundai IONIQ 9, Mercedes EQE SUV and older 400-volt models on the same route, the operator chose the vehicles with stronger 10–80% performance and better preconditioning. The result was fewer long mid-shift charging sessions and more predictable vehicle rotation during peak airport hours.
These are not exotic optimizations. They are the normal difference between treating DC fast charging like fuel and treating it like a battery-management process.
Data Checklist
| Check | 2024 View | 2026 View | Practical Rule |
|---|---|---|---|
| Peak kW | Useful marketing number | Still useful, but not enough | Never buy on peak kW alone |
| Average 10–80% | Best technical metric | Essential comparison metric | Prioritize high average power |
| Range in 20 min | 300 km became achievable | Top EVs push beyond that | Compare useful range, not battery size |
| Charger network | 350 kW sites mattered | 400–600 kW and NACS access matter more | Check route coverage before buying |
| Driver behavior | Often ignored | Major source of savings | Arrive low, precondition, leave before taper |
Network quality now matters almost as much as vehicle chemistry. Electrify America lists more than 5,600 Hyper-Fast chargers and more than 1,080 stations in North America. Fastned reported 406 stations across nine European countries at the start of 2026. EVgo states that more than 40% of the U.S. population lives within 10 miles of an EVgo fast charger.
Common Mistakes
Mistake 1: believing the charger label. A 350 kW dispenser only says what the station can provide. The car may accept 130 kW, 180 kW, 240 kW or less depending on battery conditions.
Mistake 2: ignoring cold batteries. In winter, a non-preconditioned EV can sit far below its normal curve. Always route to the charger in the native navigation when the car supports battery conditioning.
Mistake 3: charging too high. On long trips, two shorter stops from 10–65% can be faster than one long stop from 20–95%.
Mistake 4: comparing miles without efficiency. A pickup adding 150 kW may gain fewer miles per minute than a sedan adding 120 kW because it uses more energy per mile.
Mistake 5: assuming 2026 megawatt claims apply everywhere. BYD has announced a 1000V, 1000A, 1 MW Super e-Platform that can add 400 km in five minutes on compatible hardware, but that is an early high-power ecosystem, not the current global public-charging baseline.
FAQ
What is an EV charging speed curve?
An EV charging speed curve shows how charging power changes as the battery fills. The car usually charges fastest at low state of charge, then gradually reduces power to control heat, battery stress and cell voltage.
Why is 10–80% charging used for comparisons?
The 10–80% window captures the fastest and most useful part of DC fast charging. Below 10%, drivers rarely arrive in normal use; above 80%, most cars taper strongly, so the extra time is usually inefficient on road trips.
Are 2026 EVs much faster than 2024 EVs?
The best 2024 EVs were already very fast, especially Porsche Taycan, Hyundai IONIQ 6 and Kia EV6. The 2026 improvement is broader: more 800-volt models, better preconditioning, more high-power chargers, better route planning and early 500–600 kW infrastructure.
Does a 350 kW charger always charge at 350 kW?
No. The station rating is only the maximum output. The car decides how much power it can accept. Battery temperature, state of charge, voltage architecture, current limits and software all affect the actual speed.
How do I charge faster on a road trip?
Arrive at the charger around 10–20%, precondition the battery, use a charger that matches your car’s peak capability, stop around 70–80%, and plan backup sites with tools such as Tesla navigation, ABRP, PlugShare, IONITY, Fastned, Electrify America or EVgo apps.
Author's Insight
When I evaluate EV charging data, I ignore the brochure peak until I have seen the 10–80% curve. A car that holds 180–220 kW steadily is often better on a trip than one that flashes 300 kW for two minutes and then collapses. I also treat charging networks as part of the vehicle experience, not as an afterthought. My practical advice is to test your real route before you buy, because the fastest EV on paper may not be the fastest EV on your highway.
Summary
EV charging speed curves in 2024 proved that high-voltage platforms and efficient cars could make long-distance electric driving genuinely practical. By 2026, the benchmark has shifted toward flatter curves, stronger route planning, better preconditioning and higher-power networks.
For buyers, compare average charging power and range added in 20 minutes. For drivers, arrive low and leave before the taper. For fleets, measure every charging session as operational data. The fastest charging strategy is not chasing the biggest kW number; it is matching the right car, the right charger and the right state of charge at the right moment.